
Research methods have been co-evolving with computer and internet technology for several decades now. For quantitative data collection, online platforms of varying complexity enable researchers to easily deploy surveys to diverse sample populations, while Audio Computer-Assisted Self-Interview Software (ACASI) remains an option for situations when research is in-person, but self-directed. And on the qualitative side, researchers, especially those in market research, have been experimenting with various ways to collect in-depth, open-form data online since the dawn of the internet. There are several possible benefits to moving data collection to the ether: the ability to extend the reach of a sample to geographically distant or mobility-limited participants; cost efficiencies of broadening a sample without travel; the convenience of at-home participation; or the potential for removing visual social cues that might influence how a participant responds.
But how similar are the data you get when collecting data remotely rather than in-person? Especially when your research is qualitative and therefore predicated on establishing a good rapport between researcher and participant? We were curious. In a previous post, I introduced a study we conducted to find out, and shared my observations as a data collector on some of the strengths and challenges of collecting data using different online platforms compared to talking in-person. In this post, I’ll present the empirical findings from our research on three outcomes: the amount of data generated; the content of the qualitative data; and the cost of data collection.
A brief summary of the study
Topic and population
Modes of data collection
The in-person mode for interviews and focus groups in our study followed traditional qualitative data collection procedures, with the participant(s) and me seated in the same room around a table with a digital voice recorder set up between us. Online video participants used internet-connected computers, at their homes or other convenient location, at a designated date and time, to access a private online platform with web-connected video and telephone-connected audio. Participants could see the moderator, other participants (in focus groups) and themselves. Online chat-based participants in our study also logged in to a private online platform at a designated date and time. For both interviews and focus groups, I typed a question or follow-up and the participants typed their responses, all in real time, back and forth. I could ask clarifying questions or follow-up queries immediately after a response was provided.
The online email or message board mode was different in that it was asynchronous – the participants and I were not communicating in real time. For interviews, I emailed the participant three to five questions that she could respond to at her convenience, typically within 24–48 hours. My next email then contained follow-up questions based on her responses to the initial questions, along with a set of new questions; we repeated this until we completed the interview, typically within a week. The procedure was the same for focus groups, except that we used a secure message board platform. Participants logged in each day, responded to the questions, and read and commented on each other’s posted responses. I reviewed responses several times a day and posted follow-up questions as appropriate, to which participants could again respond. Most of these focus groups took a little over a week to complete.

Table 1. Summary of data collection events conducted in quasi-experimental study
Study design
The study was quasi-experimental, meaning that we set up an experiment to compare the online modes to the standard, in-person approach (our control condition) but without randomly assigning participants to the modes. Random assignment to data collection mode was not feasible given the need to coordinate five or more participants’ schedules for each focus group within a limited period of time. Instead, we assigned participants to the modes of data collection in a systematic order that did not allow them to choose based on their preference or convenience. We did randomly assign participation to either an individual interview or a focus group. Given that we wanted to compare the data generated by the different data collection modes, we attempted to control for potential confounders by minimizing differences across modalities. We kept procedures as consistent as possible while in accordance with best practices for each modality, and we used the same data collector (me) and question guide across all modalities.
Outcome measurement
At the conclusion of data collection, we conducted a standard inductive thematic analysis of the transcripts, first defining codes to represent the emergent conceptual themes identified in the data, and then having two analysts independently code each transcript before reaching consensus coding. We measured the outcome of quantity of textual data based on the original/source transcripts and used the coded transcripts to assess the thematic content of data. We also calculated the average cost per data collection event based on actual study costs. The analysis of these three outcomes that I present below are reported in this paper. We also studied the disclosure of sensitive information and participant experience with data collection, which will be reported in a separate paper and blog post.
What did we learn?
Quantity of participant-generated information
We assessed the quantity of information offered by participants, operationalized and measured as the average number of words contributed by the participant(s) within each set of transcripts by mode. We controlled for the number of participants per group in the focus group conditions. We tested these measures for differences by mode, separately for interviews and focus groups, using statistical tests (ANOVA; ANCOVA; and Tukey’s honest significance test). Though this outcome doesn’t tell us much about the “what” of the data, it does tell us something about the nature and depth of communication via each mode. Also, authors of several earlier studies reported this outcome, and we wanted to compare our findings to theirs.
Interviews
- In-person and online video modes (those with an audio-visual connection using speech) generated significantly more participant words per interview than online chat or message board (text-based) interviews (p < .001).
Focus groups
- For focus groups, the in-person and online video modes again had the highest average word counts, with significantly more words than online text-based chats (p = .001). The difference between in-person and online message boards was also significant (p = .040).
Data content – thematic analysis
More important to our original question about the effects of online data collection on qualitative data, we considered the data in terms of the meaning and content of information contributed by participants. To do this, we used the codes we had developed in the thematic analysis as tags or proxies that provided units of analysis for comparing the meaning and content conveyed within each transcript. Each unique code application (the “tagging” of a piece of text with an associated or relevant code) was considered a unit of thematic content. For instance, the code “peace of mind” was used to tag any portion of the narrative where women discussed making a particular decision in order to alleviate or avoid stress or worry from risk. We compared the presence of codes in the dataset for each mode as well as the average number of codes generated per data collection event. We tested these measures for differences by mode as above, separately for interviews and focus groups.
Across the entire study dataset (all modes and methods), we developed 85 emergent thematic codes to categorize women’s opinions and experiences. Over 85% (n > 73) of the total identified codes were present in each dataset.
Overall (for both interviews and focus groups)
- No statistically significant differences existed across modes in the overall number of codes per dataset (Table 2) nor in the average number of codes observed per transcript.
- The only differences among theme or code presence across mode came from low-frequency codes.
Interviews
- Across the interview datasets, the online video mode contained the greatest number of unique themes (n = 79) and had the highest number of unique themes per interview (n = 34).
- Though the difference was not statistically significant (p = 0.06), the online chat and online email (text-based) modes of data collection generated fewer unique themes per interview (26 and 27, respectively) than the interviews that had an audio-visual connection.
Focus groups
- Among the focus group datasets, the in-person groups generated the most unique themes (n = 80), and tied with online message board posts for the most average unique themes per group (n = 56), despite being somewhat smaller groups.
- Online video and online chat-based focus groups each averaged 47 unique themes per group.
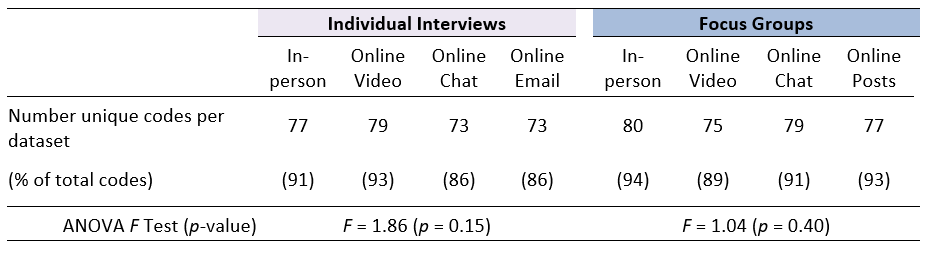
Table 2. Thematic content by mode, according to number of unique codes applied within a dataset
Costs of data collection
Decisions about data collection approach include consideration of resources, so we analyzed the comparative costs of data collection. Inputs for cost calculations included the mean time for recruitment, scheduling and conducting each event, along with spending on participant incentives, refreshments, online hosting fees and transcription costs, as applicable per mode (see Table 3). We then calculated the average cost of a data collection event for each mode by method (Table 4).
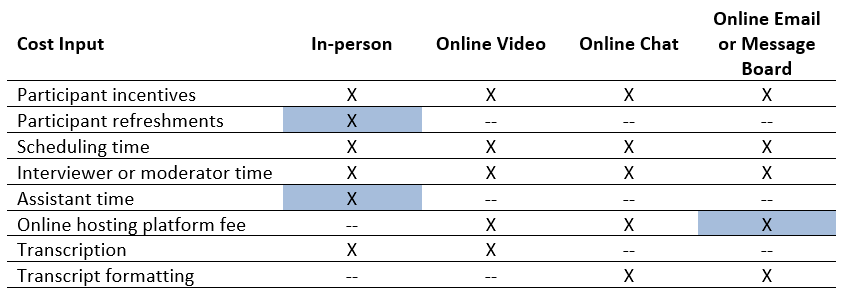
Table 3. Time and cost inputs relevant to data collection by mode (blue cells indicate relevance to focus groups only)
Interviews
- There was a nearly $200 (127%) per-event spread for conducting individual interviews, with online email the least expensive ($154) and online video the most expensive ($351) per interview.
Focus groups
- For focus groups, all of the online modes were at least 20% more expensive than in-person groups, which averaged $872 per group. The online video mode was again most expensive, at $1,595 per group, owing largely to the combination of platform hosting fee and need to transcribe.
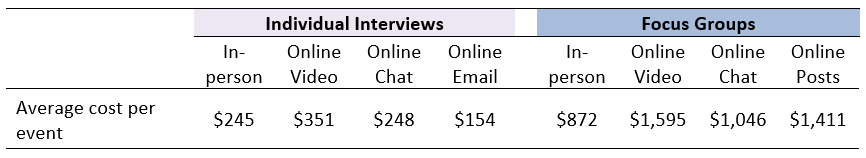
Table 4. Average data collection costs across eight study arms
Since one of the purported advantages of remote data collection is the ability to gather data from a more geographically diverse sample without incurring travel costs, we modelled what the inclusion of travel costs for the in-person interviews and focus groups might do to average cost. We based our travel costs (roundtrip airfare, one night of lodging and one day of meals) on estimates provided by Rupert and colleagues (2017) who had undertaken a similar analysis. For interviews, we divided this cost by four, presuming that four individual interviews could take place in one day. Adding in these travel costs increased the per-interview cost to $445 and the per-focus group cost to $1,672, making them the most expensive in each category, though not exorbitantly so. (The actual costs recorded by Rupert et al., based on travel from Raleigh-Durham to Atlanta, were less than the estimated costs and, if used, would reduce the per-event costs of interviews and focus groups to $395 and $1,472.)
So, what’s it mean for choosing a mode of qualitative data collection?
Obviously one of the major disadvantages of online modes of data collection is that they require technology and an internet connection which are not accessible to many populations we work with, and maintaining that connection reliably and with good quality is a challenge even in my own office sometimes. But for environments where online data collection is a feasible option, the encouraging news, particularly for applied qualitative researchers, is that the mode of qualitative data collection doesn’t seem to have a great effect on the content of the findings generated.
Despite differences in the amount of textual data generated, the primary themes identified in the analysis came through clearly in all modes of data collection. Had we conducted only in-person or only online chat interviews, for example, the resultant thematic reports would have been structured on nearly identical outlines, based on the shared thematic content generated. The minor variations we observed in thematic expression, as indicated by code application, were all within less common or low-frequency themes that would not have substantially altered the narrative summary.
And while our findings on costs to conduct online research challenge a common perception that online data collection is quicker and cheaper (it’s usually not unless travel is required for in-person data collection), if you can gain geographic or other participant diversity through the use of online data collection, the slight increased relative cost may be worth it.
So, on one hand, we could agree with earlier research that online text-based modes of qualitative data collection are “efficient” in that they deliver a similar number of ideas in fewer words, suggesting that some portion of the additional words generated via speech are extraneous or off-topic. At the same time, however, as Brüggen and Willems (2009) have noted, the “efficiency” of online text responses can make them seem “thin,” missing some of the descriptive illustration others have cited when attributing greater richness to data collected in-person or via online video. Campbell et al. (2001), for example, characterized in-person groups as more expansive in the use of stories and narratives, which can help add context for analytic interpretation, and our data showed similar trends. The similarities between in-person and online video-based findings on data quantity and content confirm what we might intuitively assume, that an audio-visual connection with verbal exchange flows faster and “richer” than having to type our communication, whether at the same time or asynchronously.
These findings lead to a conclusion similar to the one I reached in my earlier post: from a researcher’s perspective there is no best mode of data collection among the ones we tested, but there is not a bad one either. What we’re missing still is the perspective of the participants: how did they feel about and experience these different ways of communicating with a researcher? In my next post, I’ll compare their feedback on the different modes of communication and discuss how those findings align with the amounts and type of sensitive information and personal disclosures we found in the different datasets.
Photo credits: pch.vector/Freepik; secondfromthesun0/pixabay; pressfoto/Freepik; rawpixel.com/Freepik