As education researchers we know that one of the greatest threats to our work is sample attrition – students dropping out of a study over time. Attrition plays havoc with our carefully designed studies by threatening internal validity and making our results uncertain. Stratford et al. (1999) note that attrition is even more problematic in longitudinal designs seeking to follow a cohort across multiple years, particularly when there are high levels of student mobility. To gear up for our evaluation of the Pennsylvania State Gaining Early Awareness and Readiness for Undergraduate Programs (GEAR UP), we designed a three-pronged approach to handling sample attrition. We describe it here in case it can be helpful to others.
GEAR UP uses early interventions to increase the number of low-income middle and high school students who are prepared to enter and succeed in postsecondary education. In our impact evaluation of the Pennsylvania State GEAR UP, we follow a cohort of students from 8th-grade to their high school graduation in 2020. Despite the richness of the student data available, we are concerned about the effect of attrition on our ability to provide good answers to our evaluation questions. Analysis of previous graduating classes suggests that due to a combination of student mobility and grade retention, sample attrition may be as high as 75 percent in some schools for a single year. Needless to say, over the course of several years this would lead to extremely severe attrition problems!
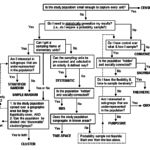
Such high levels of attrition are likely to introduce unacceptable levels of bias into our study findings. The What Works Clearinghouse (WWC) attrition standards provide guidance on acceptable and unacceptable levels of attrition based on a model for defining potential attrition bias and certain empirically-based assumptions.
The WWC defines potential attrition bias as a function of overall (i.e., the rate of attrition for the entire sample) and differential (i.e., the difference in rates of attrition for treatment and comparison groups) attrition and its relationship with outcomes. Then depending on the attritions’ relationship to treatment status, provides both liberal (attrition unrelated to treatment) and conservative (attrition related to treatment) boundaries for acceptable levels of attrition. Considering little differential attrition (i.e., 0.3%) the liberal attrition boundary allows for an overall attrition rate of 65 percent before reaching an unacceptable level of bias, while the conservative boundary only allows for an overall attrition rate of 55 percent.
Given GEAR UP’s focus on postsecondary attainment, it is reasonable to assume that exposure to GEAR UP may be related to attrition in some way and that conservative attrition boundaries apply. For example, the GEAR UP cohort may experience lower dropout rates as the program works to keep students engaged and active in an effort to increase student graduation rates.
So what to do? To establish baseline equivalence of the post-attrition sample, we have designed the following three-pronged approach to addressing attrition for our evaluation: identify the presence of attrition bias; match the student cohorts based on their weighted demographic profiles; and impute the missing outcomes data as a result of attrition.
- As described in Ahern and Broque (2005), we begin by determining the amount of missing data and whether or not attrition may have biased results. The analysis entails disaggregating GEAR UP’s overall sample attrition by school and district to look for patterns of missing data as suggested by Rubin (1976). For each outcome measure, the analysis will measure the extent to which missing data is independent of its response values and other observed variables to determine if missing data is missing completely at random, missing at random, or missing not at random.
- To ensure post-attrition equivalence of groups we will adapt Burkam and Lee (1998)’s study of attrition bias. Our final statistical model will employ sample weights that match the joint (GEAR UP/Non-GEAR UP) distribution on observed variables (i.e., gender, race/ethnicity, Limited-English Proficiency, and Individualized Education Program [IEP] status) during the year in which students entered the program. This weighting process will be repeated each study year, as new students enroll. For example, students entering the program during 8th-grade will be matched to the comparison distribution observed in the 8th-grade year, and so on. This process allows us to isolate changes in our outcomes that are independent of changes in our sample population and it has the added benefit of allowing us to examine the effects of program intensity (via number of years participating).
- Lastly, we will make a deliberate effort to retain student observations in the analysis wherever possible. For example, many students may withdraw prior to a final grade being entered but still have relevant quarterly grades information. In these cases, we will impute a students’ final grade based on the school they attended, the course, and any grades they may have received during the quarters prior to withdrawing. This approach follows the examples of Heckman (1976) and Hirano et al. (2001) who show that imputing missing data and weighting the observed data can adjust for the attrition.
Ideally, students would never change schools, never get left back, and never drop out so that we could easily follow every student throughout their school career and accurately measure program impact. Our hope is that our careful approach to addressing attrition will allow our evaluation to produce important evidence on the effectiveness of GEAR UP for addressing some of the challenges these students face.
The authors would like to acknowledge Sam Field, biostatistician at FHI 360, for his expertise and contribution to this post and analysis plan.
Photo credit: Ryan Stanton/CC BY-ND 2.0 license