
I recently posted about a new ICT4D evidence map that Hannah Skelly and I published in Information Technologies and International Development. In that post I wrote a bit about the methods used to build the map and discussed the main gaps in ICT4D evidence that we identified from the map. In this post, I will talk more about how we can use evidence maps for finding and understanding the evidence that does exist and I’ll give an example for digital identity motivated by a new McKinsey Global Institute report.
The word ‘cell’ in the title of this post does not refer to biology nor to mobile phones. Instead, it refers to a cell in an evidence map. As I explained in my earlier post, an evidence map, or evidence and gap map, is simply a matrix with intervention categories as rows and outcome categories as columns. Each cell then provides information about the size of the evidence base for the effects of interventions in that cell’s row category on outcomes in that cell’s column category. The evidence and gap maps portal managed by the International Initiative for Impact Evaluation (3ie) uses bubbles to reflect the relative number of impact evaluations in each cell (along with other bubbles for systematic reviews). I personally prefer numbers and shading – darker shading for larger numbers – over bubbles, so that a map presents both absolute information and relative information at a first glance.
What not to do when reading an evidence map
The first thing to remember when reading an evidence map is that a large number of studies in a cell does not mean that the intervention works to achieve the outcome. It only tells you that there is a lot of evidence about whether the intervention works to achieve the outcome. You need to read those studies and synthesize the evidence to answer the ‘whether’ question.
When I was at 3ie and talking to stakeholders about evidence and gap maps, they would always ask, “can’t you just code whether the studies in the cell find a positive effect and then shade the cell or the bubble accordingly, for example green if most of the studies measure a positive effect and red if most of the studies measure a negative effect?” The answer to that question is NO. In short, that would be evidence synthesis via basic vote counting, which is something that systematic reviewers (some quite vehemently) warn against.
Here is the simple explanation that I used then and still do when I get that question. Suppose you have a cell with four studies in it. Three of those studies measure the effect of pilot interventions designed and implemented by researchers and tested on small samples, say, 50 in the intervention group and 50 in the control group. They all find a statistically significant positive effect. The fourth study measures the effect of a program at scale implemented by a government using a sample of 2,000 in the intervention group and 2,000 in the control group, and it finds no effect. The vote counting approach would produce a green bubble. But would you really conclude that interventions in that category are effective?
More generally, there are multiple factors to consider when synthesizing evidence. The two above are sample size and comparability of the interventions studied. Additional factors include the comparability of the contexts, the comparability of the outcomes measured, and the quality of the research. Further on the last factor, even in maps that select based on methods, there can still be meaningful differences in how the research is conducted and reported that affect how much confidence one might have in the measured effects. A good systematic review analyzes all those factors, but a systematic review also typically includes a smaller set of studies for a narrower question than covered by a full evidence map.
What to do
We can also access the studies mapped into a specific cell to analyze the evidence according to a specific question or need. The evidence and gap maps in the 3ie portal are interactive and the user can open a bubble and then click through to the source site for each study. For our ICT4D map, we present the supplementary materials to the journal article here, where you can find the citations and links to sources for all of the studies in each cell.
A digital identity example
Just recently I saw the announcement for a new McKinsey Global Institute report, “Digital identification: A key to inclusive growth” by White et al. (2019). They argue, “For emerging economies, while the share of the economy that digital ID can address tends to be modest, scope for improvement can be sizable, leading to average potential per-country benefit of roughly 6 percent of GDP in 2030” (p. vi). Their methodology is to describe 100 possible uses of digital identity across seven countries and then to perform a “sizing of the potential given certain assumptions” (p. 101). While this is not an impact evaluation approach, the report did lead me to ask, what is the evidence for attributable impact from digital identity interventions?
Looking at the map below, we see there are five occurrences in the map for the digital identity intervention category. I say occurrences because it is possible that one study measures multiple outcomes across different sectors. Looking at the Excel file in the supplementary materials, I see that there are indeed five studies. One thing I can see just by scanning the titles is that three studies are from India, one from Malawi, and one from Uganda. That tells me something about the comparability of context across studies. As it turns out, India is also one of the seven countries included in the McKinsey report.
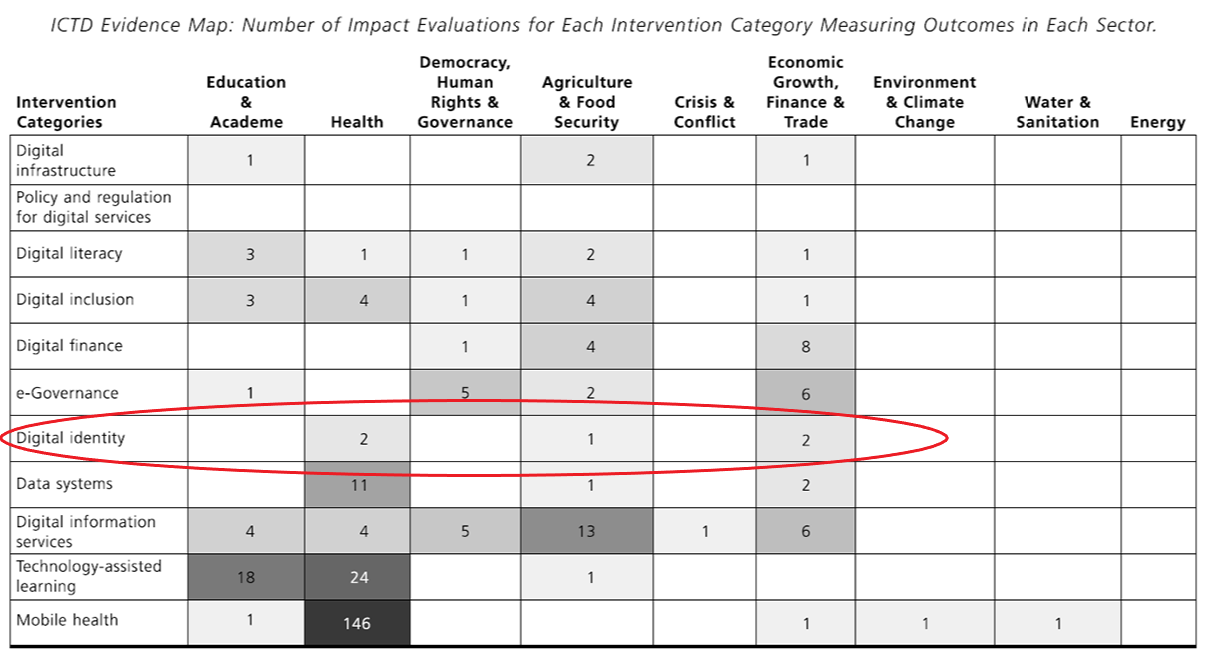
(Table 6 from Brown, AN and Skelly, HJ. How much evidence is there really? Mapping the evidence base for ICT4D interventions. Information Technologies and International Development, Vol. 15, 2019.)
I’ll focus on the cell for the effect of digital identity interventions on economic growth outcomes, which has two studies, both from India. The first is Barnwal (2016) “Curbing leakage in public programs with direct benefit transfers evidence from India’s fuel subsidies and black markets”. Because this was a working paper when we built the map, I looked to see if it has been published. Turns out, there is a more recent working paper and also a blog post, published just this month, about the study. In this case, the intervention tested is not digital identity per se, but rather, an intervention that paid fuel subsidies directly to households made possible by India’s unique ID system. Using a natural experiment design and data from 23.2 million transactions, Barnwal (2018) estimates that the intervention (which has subsequently been terminated) did benefit households.
The second study in the cell is “Building state capacity: Evidence from biometric smart cards in India” by Muralidharan et al. (2016). The authors implemented a large-scale randomized controlled trial (157 subdistricts covering 19 million people) of biometric smart cards that allowed for authenticated payments to the targeted beneficiaries of the government employment and pension programs. They find that the intervention delivered a “faster, more predictable, and less corrupt…payments process” (p. 2895). Even better they looked at the cost of the program and found it to be highly cost effective.
Conclusion
Using the evidence map, I quickly see that there are very few impact evaluations from low- and middle-income countries that measure effects relevant to the McKinsey report. There is likely a few more studies today than in the map, but probably not many more. That doesn’t mean the McKinsey analysis is wrong, just that there isn’t much evidence about their assumptions. (Unfortunately, McKinsey does not cite even one of the five impact evaluations that we do know exist.) On the other hand, digging into one cell of the map, I see that two large, high-quality studies from India do measure positive benefits from the government’s use of digital identity in benefits programs. That is encouraging.
In sum, we can use evidence map data to analyze the size, scope, and features of the evidence base for a theme or topic or even sector. But we can also use an evidence map as, well, a map that leads us to collections of individual studies – not just any collections, but collections resulting from unbiased search and screening techniques. From those collections, we can then synthesize or select those studies as desired.