
Recent education projections from the UNESCO Institute for Statistics (UIS) and the Global Education Monitoring (GEM) Report show that the world is far off track from achieving educational outcomes under Sustainable Development Goal 4 (SDG4). Education enrollment projections, which use past data to predict future trends, are frequently used to set targets and establish expectations for progress. How accurate those projections are depends on the quality of the available data and reasonableness of the assumptions around the key driving forces in education – population growth, intake rates and retention. A certain amount of fluctuation is expected, and they cannot be accurate in all cases. Still, it’s helpful to know how much one should trust and rely on projection models, particularly when they are used for large-scale monitoring against SDGs.
Our team at FHI 360 has developed and used projection models since 2009. Recently, we tested the accuracy of our Education Policy and Data Center (EPDC) projection model from 2012 against five years of actual data from UIS. While our expectations of accuracy had been modest, we find that on the whole, where country contexts are stable, the projections are close to reality. Where we have been inaccurate, and sometimes highly inaccurate, is in countries that have experienced shocks to the education system. Here we share examples from our initial findings.
How did we test our EPDC projection model?
Our EPDC projection model relies on a trend-based methodology that estimates future pupil volume and rates using historical data from 2000 to 2011 to make projections from 2012 to 2025. We ran predictive regression models with gross intake rate, repetition rate and dropout rate, and then imposed expected rates of change onto future trends. We calculated rates of change separately for countries at higher and lower levels of historical progress during the period of 2000 to 2010, and set the rates to stabilize once the intake rate into the education system exhausted the population of school-age eligible students. More information on our EPDC projection modeling assumptions and methodology is available here. To test the accuracy of the model, we re-ran the education projections with updated population projection data from 2012 to 2017 and calculated percentage differences between EPDC education projections and updated UIS data for this five-year time period.
What did our projections show?
After re-running projections for 45 countries from 2012 to 2017, we find that projections of the number of primary pupils are accurate approximately 65% of the time as shown in Figure 1.
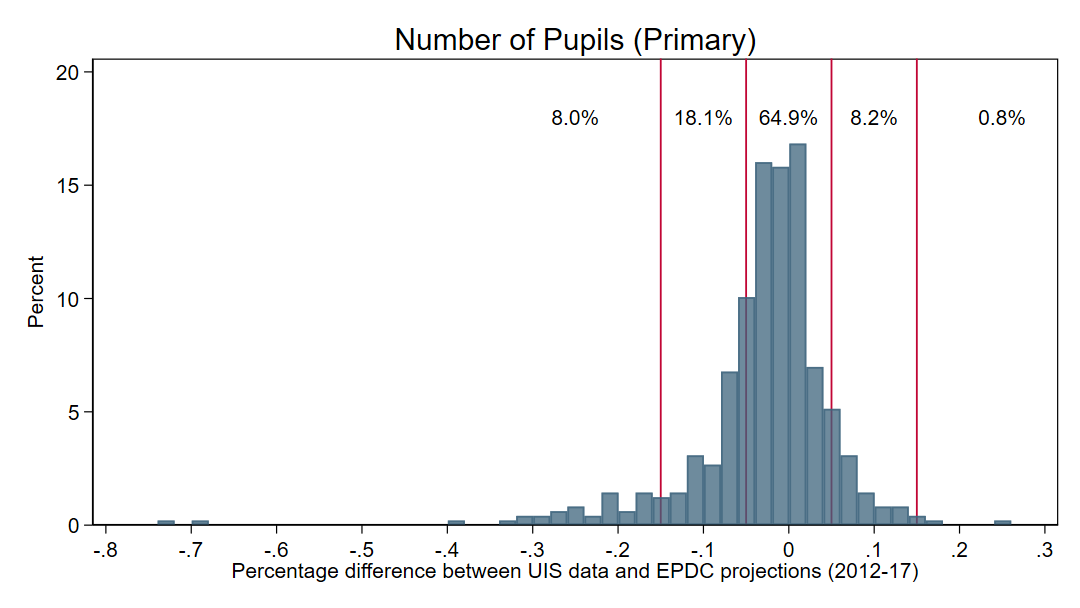
Figure 1. Accuracy of EPDC projections for number of primary pupils
Upon qualitatively exploring the inaccurate cases, we find that almost all inaccurate projections fall into one of the following two categories: 1) inaccurate due to education policy reform, or 2) inaccurate due to conflict or war.
We share three examples that illustrate these findings below.
Case 1: Accurate projections
When our projections are accurate, like the Malawi projections shown in Figure 2, educational outcomes continue to trend in the same direction as they were historically trending with similar growth rates. Accurate projections tend to occur in stable country contexts in which there are no external factors that significantly impact the school-age population or the provision of education.
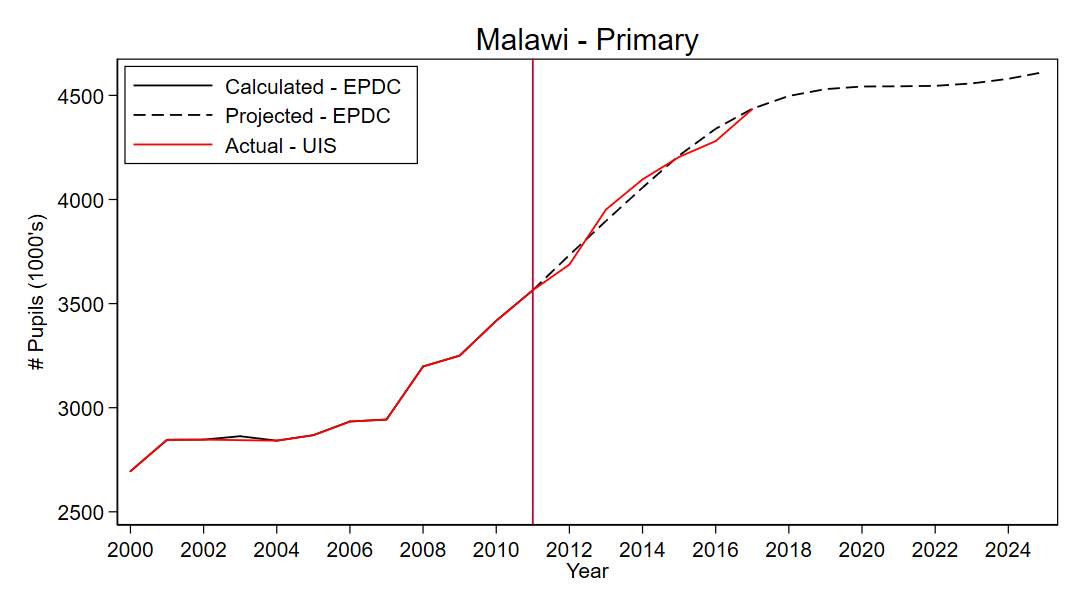
Figure 2. EPDC projections vs. actual data for number of primary pupils in Malawi (2000–2025)
Case 2: Inaccurate projections due to education policy reform
For a few countries, our projections are inaccurate due to education policy reform that occurred since 2012. For example, in Iran, the large spike in the number of primary pupils from 2012 to 2013 is due to a change in national education policy that increased the required duration of primary schooling from five to six years. As shown in Figure 3, we can see that this reform led to two million more primary pupils being counted from 2012 to 2013.
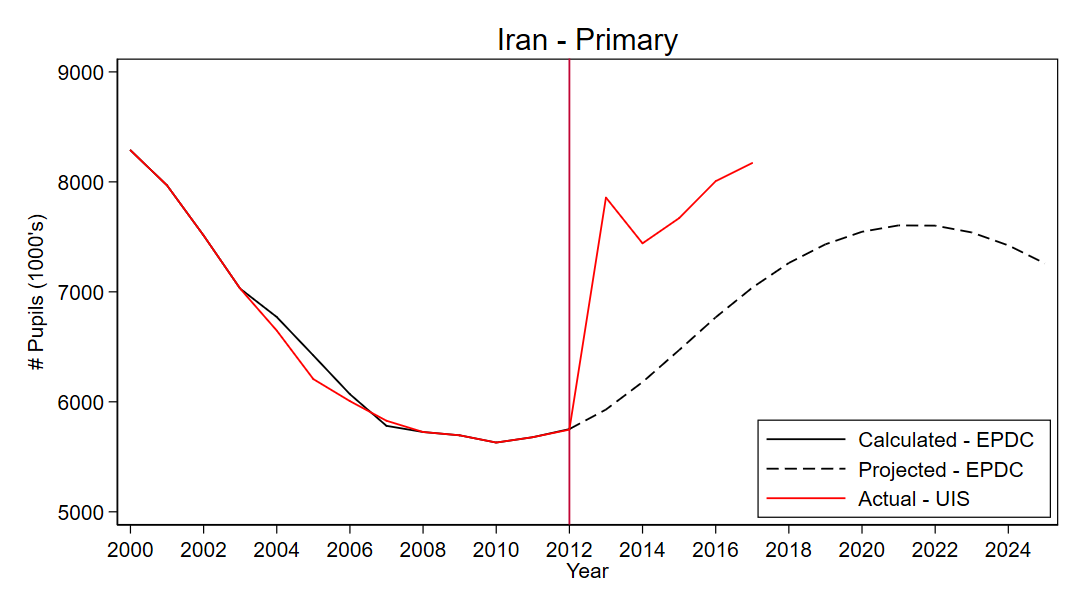
Figure 3. EPDC projections vs. actual data for number of primary pupils in Iran (2000–2025)
Case 3: Inaccurate projections due to conflict or war
We find multiple cases in which projections are inaccurate due to political violence, conflict or war that occurred since 2012. The most dramatic example of this is in Syria, as shown in Figure 4, where we see a decrease of one million primary pupils from 2012 to 2013. This timing directly corresponds with the onset of conflict in the country. The example of Syria also highlights the lack of education data during conflict – as no UIS education data exists beyond 2013.
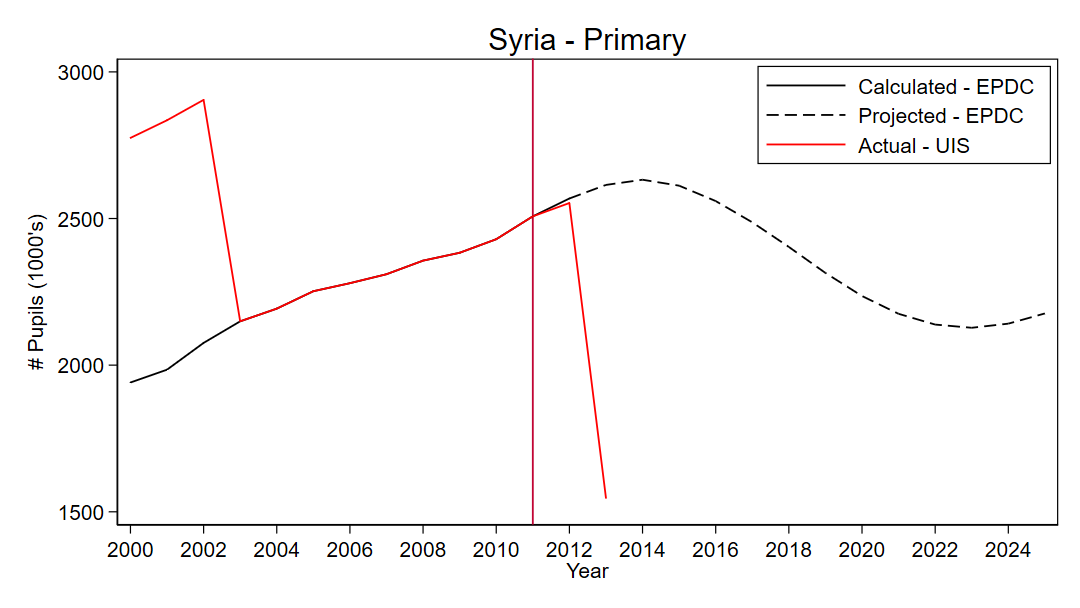
Figure 4. EPDC projections vs. actual data for number of primary pupils in Syria (2000–2025)
Figure 5 shows that a similar phenomenon occurs for education projections in El Salvador, Guatemala and Honduras. These three countries comprise the “Northern Triangle” which experienced high levels of gang violence in recent years leading to an increase in asylum seekers fleeing the region. Additionally, projections in Venezuela are increasingly inaccurate beginning in 2015, which is around the time that political and civil unrest erupted in the country, leading to one of the largest refugee crises in the world.
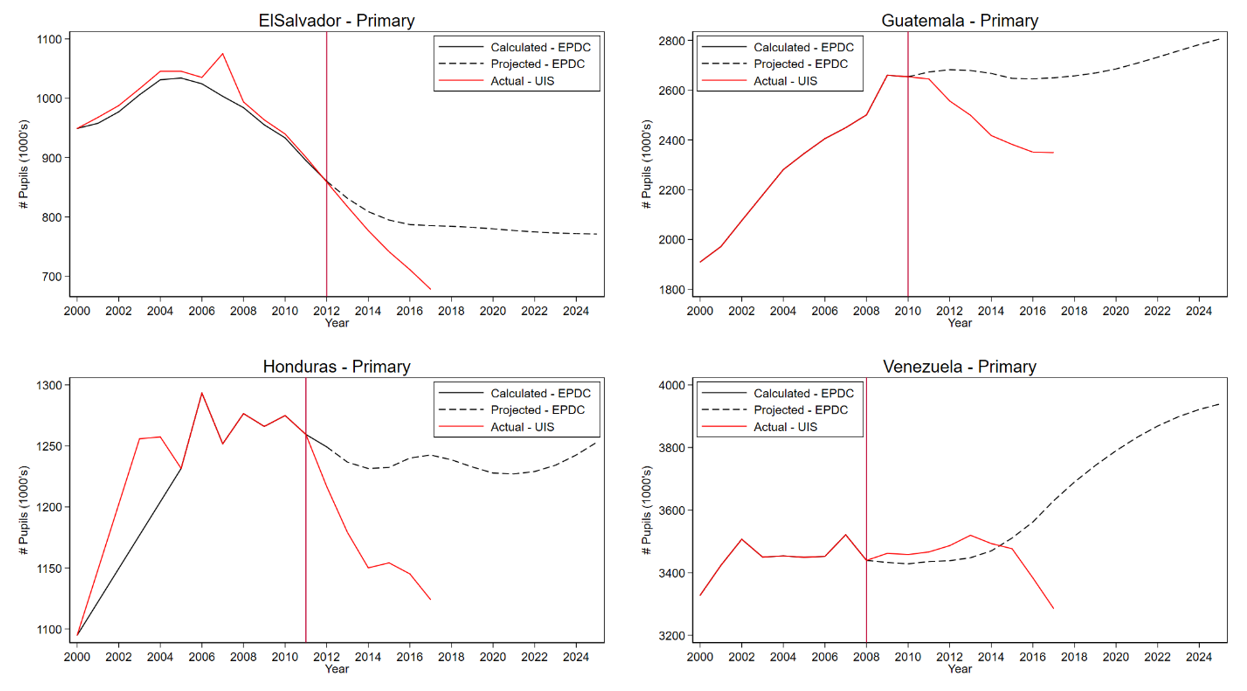
Figure 5. EPDC projections vs. actual data for number of primary pupils in El Salvador, Guatemala, Honduras and Venezuela (2000–2025)
Going forward: Using and improving education projections
Overall, we find that EPDC trend-based education projections for the number of primary pupils are accurate approximately two out of three times. We find that in stable country contexts, our short-term projections are actually highly accurate. In cases that are inaccurate, we are able to pinpoint specific causes that may have led to these inaccuracies, including education policy reform and external shocks to the education system, such as conflict. Future education projections may be improved by incorporating these historic shocks into models and by having greater education data availability, especially in emergency and conflict-affected contexts.
As the education community continues to monitor progress towards SDG4 using education projections, it’s important to set clear expectations and review assumptions on a regular basis. Trend-based projection models work best in stable environments and have to be continuously adjusted in situations of policy change, conflict or migration shifts.
In order to better track progress toward international education goals, inform education sector plans and ensure the next generation of students has access to equitable schooling, we must continue to build upon current data collection methods, tool development and projection methodologies. You can explore more EPDC education projections here and access the EPDC database here for your own education projections and research.
This post is cross-published on FHI 360’s EPDC Data Points blog.
Photo credit: Klaus Vedfelt/Getty Images