The World Health Organization (WHO) recently published new global guidelines on how to do biobehavioral surveys related to HIV infection in a document known as the Blue Book. The Blue Book replaces the previous Red Book of guidelines for such surveys. The updated guidance keeps the global health community abreast of the evolving HIV epidemic, which has led to 37 million people currently living with HIV infection. Biobehavioral surveys provide population-level estimates for the burden of HIV disease and HIV-related risk factors, and they allow estimation of the coverage of prevention and treatment services for key populations that are at increased risk for HIV. Advances in available data and changes in the epidemic rendered the survey tools and guidelines in the Red Book out-of-date. In this blog post, we’re going to highlight how the new Blue Book addresses these critical gaps to deliver a manual better suited to the era of ending AIDS.
Since the Red Book’s release, new HIV prevention, care and treatment practices – coupled with the emergence of new data needs, methods and technologies – warranted a thorough update of the 2000 publication. In particular, there is an increased understanding of, and focus on, key populations. These key populations include men who have sex with men, sex workers, people who inject drugs, transgender individuals, prisoners and other vulnerable populations. For many of these stigmatized and socially marginalized populations, conventional sampling frames are unsatisfactory, requiring the use of complex sampling designs.
The Blue Book – “Biobehavioural survey guidelines for populations at risk for HIV” – thoroughly updates the Red Book. It was produced by a collaboration of UNAIDS, WHO, the U.S. President’s Emergency Plan for AIDS Relief (PEPFAR), the U.S. Centers for Disease Control and Prevention (CDC), and FHI 360. The updated guidelines cover all aspects of surveying key populations, with new emphases on these three objectives.
- Describing sampling methods for hard-to-sample populations
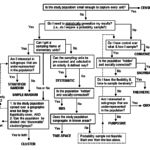
The Red Book promoted probability sampling methods as the preferred choice for behavioral surveillance surveys “whenever feasible.” Probability sampling allows for statistical generalization. Ideally for probability sampling, the sample selection process is randomization using a sampling frame. At the time of the Red Book’s release, these probability sampling methods included simple random sampling and multi-stage cluster sampling. These methods appear on the left side of Greg Guest’s sampling decision tree.
When it is not possible to get sampling frames of elementary units, other methods can be used to generate probability samples. The Red Book popularized the time-location, or time-space, sampling method. Time-location clusters can be used when the populations included in surveillance come and go freely from sites, which may vary from day to day, and even by time of day or by the time of the month. Unfortunately, if people with various levels of risk visit a site at different times, then the time selected for sampling may affect the results of survey and make it less representative of the population as a whole.
For situations where hidden populations are prominent (often due to illegal or highly stigmatized behaviors) and time-location sampling is unlikely to be representative, the Red Book promoted non-probability methods including snowball or network sampling. These non-probability methods result in convenience samples. See the right side of the Guest decision tree.
In the years after the Red Book’s release, a new probability sampling method, respondent-driven sampling (RDS) rose to prominence. While it was first introduced in 1997 by Douglas Heckathorn, RDS gained traction in behavioral and biological surveillance starting in 2004 thanks to this article by Salganik and Heckathorn. RDS is similar to snowball or chain-referral systems; however, by collecting data on social network size and limiting recruitment through using a set number of coupons, RDS obtains results that are generalizable for the population. Salganik and Heckathorn demonstrate using mathematical theory that a sample reaches a probability sample after a sufficient number of waves (recruitment chains) have been reached.

Figure 1: Sampling decision tree (S. Mills et al., 2004)
Based on the Salganik and Heckathorn work, FHI 360’s Steve Mills and colleagues published the decision tree in Figure 1 to help guide decisions specifically on probability sampling methods when dealing with subpopulations.
The Blue Book thus updates the Red Book by endorsing RDS as the method of choice for sampling hidden populations. The jury is still out on whether RDS generates an actual probability-based sample, with some studies suggesting it may result in a sample that over-represents younger individuals of lower socio-economic status. However, RDS currently represents the best available method for sampling hidden populations. The chain-referral process is also being used to good effect in social networking strategies for identifying new key populations in programmatic contexts.
- Integration of methods for estimating size of key populations
An important data need for addressing the 90-90-90 targets, where the first target requires expanded HIV testing, is estimates of key population sizes. Valid estimates of population sizes are important for understanding gaps in HIV testing coverage and for planning expanded access to HIV testing services. Population size is also important information for monitoring and evaluation efforts.
In 2003, FHI 360, with support from USAID, and together with UNAIDS and WHO, published the manual “Estimating the size of populations at risk for HIV: Issues and methods.” UNAIDS produced an updated manual in 2010. The Blue Book integrates the latest thinking on population size estimation methods into the overall biobehavioral survey guidance. This integration takes advantage of the opportunity provided by biobehavioral surveys to include questions that can be triangulated with other data sources and used for size estimation purposes (see in particular part 2b below). Here is a selection of population estimation methods included in the Blue Book:
- Census and enumeration method – just like a census, this method involves physically counting key populations at identified venues. This method can result in a valid population estimate if nearly all target group members frequent certain venues and can be identified. It can be paired well with time-location sampling in a biobehavioral survey, as the mapping and enumeration process can be used to construct the sampling frame. However, it doesn’t work with hidden populations. FHI 360 has contributed to variations of this method, including the reverse tracking method (included in the Blue Book) that originated from the Avahan project in India.
- Multiplier-methods – multiplier methods are relatively straight forward to use and are perhaps the most widely used size estimation approach. Two multiplier methods that are low-cost and make use of both survey and program data are the service (or event) multiplier and the unique object multiplier. These methods estimate the size of a population by applying a multiplier to the number of unique individuals attending a service or event or receiving an object. The multiplier is the inverse of the proportion of key population members in a representative survey (like biobehavioral surveys) who report accessing the service, attending the event, or receiving the unique object. There are four key assumptions behind this method: 1) the data are for unique individuals (i.e., no double counting); 2) both data sources are using the same definition for the population; 3) data from two sources are available for the same time period; and 4) both data sources have the same catchment area.
- Capture-recapture – this method originated for estimating populations in wildlife settings, for example the number of fish in a pond. The first stage involves catching a certain number of fish and then tagging them and releasing them back into the pond. The number of fish tagged and released is used in the same way as the number of unique individuals accessing a service or attending an event in the service multiplier calculation described above. The second stage involves catching a sample of fish in another location and seeing how many of this sample are tagged. The number tagged divided by the total number in the sample caught is the proportion of tagged fish in a representative sample. The inverse of this proportion is the multiplier applied to the number of fish tagged in the first stage.
This method is not suited to mobile populations, who may leave a town or city after being “tagged” the first time (which is usually done by giving them a unique object), and therefore can’t be counted as being tagged the second time. If they are not able to be sampled the second time, it introduces a bias to the multiplier calculation. An important requirement of the capture-recapture method is that the two data sources, i.e., where and when the tagging and then the counting of tags occur, should be independent. This independence can be difficult to achieve in settings where key populations are highly stigmatized (hidden), and access to their networks is extremely limited (e.g., access to the networks is through a single organization or small group of peers). It can be difficult and costly to implement with fidelity. On the other hand, the capture-recapture method does have an advantage over the standard multiplier methods in that it doesn’t require an accompanying survey (based on a random sample).
- Other methods – a representative survey of the general population provides a low-cost opportunity for estimating the size of key populations if a question on the particular risk behavior is included, thereby enabling a population-level estimate of the prevalence of that particular behavior (e.g., sex work, injecting drug use, men having sex with men). However, there are concerns about the extent of social desirability bias when answering sensitive questions like these in a (typically) household setting, which causes the actual prevalence of the risk behavior of interest to be under-estimated.
Network scale-up is another method from general population surveys. It calculates population size by analyzing the proportion of members of a key population group (those known to the respondent) within the total (personal) network size of all people known to them personally.
Finally, in settings where very little is known about a key population group (usually due to their highly stigmatized/illegal behavior and absence of programs targeting them), and other methods cannot be employed, the Delphi method, or “wisdom of the crowd” can be used to generate crude estimates from expert opinions.
Given the limitations of any single method, particularly in settings where key populations are hidden, mobile, and highly stigmatized, the gold standard is to apply three or more methods and triangulate the estimates to arrive at a more robust estimate, or one that can smooth out the various limitations of any single method. There are no hard and fast rules to arriving at estimates from triangulation. Consequently, the methodology for arriving at triangulated estimates should involve consensus building among relevant experts. A good start is to bring methodological and key population experts together to review the strengths and weaknesses of each method in its local context and consider excluding methods deemed inadequate. The experts can review estimates that are extreme outliers, and then average the estimates deemed reliable, or present the results as a range between the lower and higher estimates.
- Inclusion of biomarker measurements in surveys
The Red Book dealt exclusively with behavioral surveillance surveys, especially data from questionnaires. Subsequently, the emphasis in HIV surveillance has shifted towards second generation surveillance, which refers to interpreting behavioral together with biomarker data (i.e., the testing of biologic specimens for HIV and other STIs). Use of biomarkers permits a comparison of information on HIV prevalence with data on the behaviors that spread the infection to create an informative picture of changes in the epidemic over time. The types of biomarkers vary, but those of key interest include both HIV incidence and prevalence.
In its coverage of biomarkers, the Blue Book draws on the UNAIDS/WHO “Guidelines for using HIV testing technologies in surveillance: Selection, evaluation, and implementation – 2009 update” for designing HIV testing algorithms for various surveillance purposes and in different epidemiological contexts. The new guidance covers tests involving venous and dry blood, saliva, urine, and ano-rectal as well as endo-cervical swabs for STIs including: HSV-2, gonorrhea, chlamydia, trichomonas, syphilis, and hepatitis B and C virus.
Other updates in the Blue Book include a new section on formative assessment, new survey questions around the global 90-90-90 targets, questions around health service access and stigma, updated ethical guidance (including conducting studies among incarcerated populations), as well as guidance around conducting surveys electronically. The Blue Book also contains an expanded section on study monitoring (tools and standard operating procedures) and enhanced attention to disseminating and using the findings from studies. A forthcoming addition to the Blue Book will include ready-to-use electronic questionnaires specific for each key population and translations into French, Russian, and Spanish.
In order to end the HIV/AIDS epidemic, we need to understand where the epidemic is moving and where we need to devote more resources to fill unmet needs. The updated Blue Book includes the best available guidance for collecting – and standardizing – data on HIV through biobehavioral surveys. The proliferation of biobehavioral survey studies in recent years among key population groups, particularly in sub-Saharan Africa, reflects a better understanding of the mixed nature of epidemics, including those classified as generalized. These surveys increase our knowledge of the important links between members of key populations and the general population, and provide important new opportunities to inform comprehensive programs that leave no one behind in the quest to end AIDS. We hope these updated guidelines will lead to a more effective and efficient response to HIV.
Download the Blue Book at:
http://www.who.int/hiv/pub/guidelines/biobehavioral-hiv-survey/en/
Supplemental materials:
http://apps.who.int/iris/bitstream/10665/258924/2/9789241513012-supplement-eng.pdf?ua=1
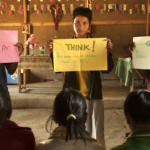
Photo credit: Pradeep Tewari/Photoshare